

GPU rental rates have surged while the cost of an AI token has collapsed. The gap between them is where the AI economy’s profits—and its losses—are being decided.
Research & Analysis: ICTpost Computing Intelligence Bureau (CIB)
Published by ICTpostUSA | Compute Markets Research Series
Two numbers describe the AI economy in the autumn of 2026, and they point in opposite directions.
The first is $9.70. That is what an hour on an Nvidia B200, the workhorse chip of the current data-center build-out, cost on the spot market this month, according to the Ornn Compute Price Index. It has more than doubled since Ornn began tracking the chip in late 2025. The H200, one generation older, is up 76% over the same stretch, to $6.30.
The second is 97 cents. That is what the market paid, on average, for one million AI tokens at the end of August, according to the Silicon Data LLM Token Expenditure Index published on Bloomberg under the ticker SDLLMTK. It was roughly $2.05 in May. In August alone it fell 29%, dropping below a dollar for the first time, a move flagged in a client note from Goldman Sachs’s trading desk (Wall Street CN, citing Goldman Sachs).
Put the two together and you have an unusual pair of charts: GPU rental prices are rising even as the effective price buyers pay for AI tokens is falling. The two indices measure different things—a GPU-hour is rented capacity, a token is model output, and how many tokens an hour yields depends on the hardware, the model and how efficiently it is served. But in most industries the main input and the finished product do not move this far apart for this long without someone’s margin absorbing the difference.
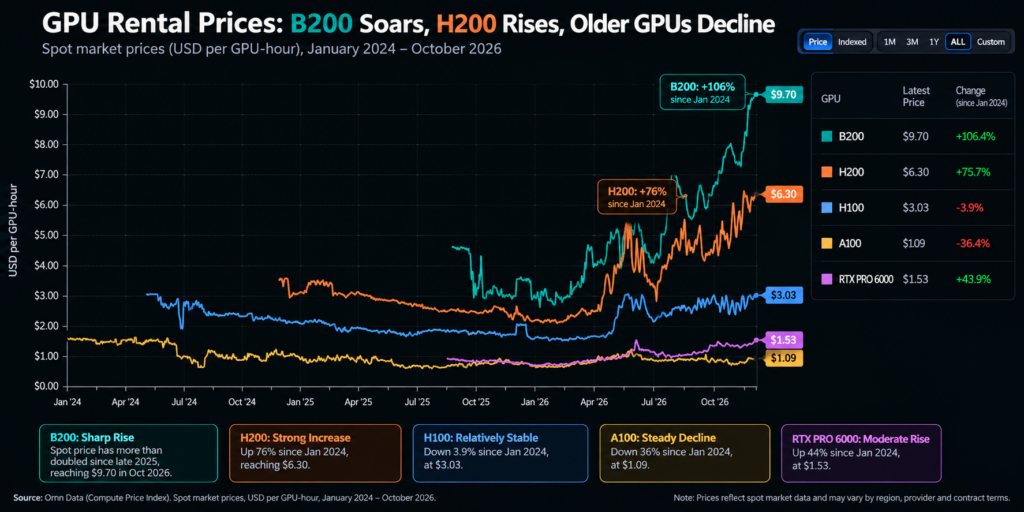
Figure 1: Spot rental prices, USD per GPU-hour, January 2024 to October 2026. B200 (green) and H200 (orange) have climbed steeply since spring 2026; the A100 (gold) has lost a third of its value. Source: Ornn Data.
Yet that is the AI economy today. And it raises the question this feature set out to answer: from the GPU-hour to the token, who is actually capturing the value?
Upstream and downstream
Wayne Nelms, chief technology officer of Ornn, which publishes benchmarks for both prices, frames the relationship in the vocabulary of the oil patch.
“GPU-hour prices are the upstream commodity input: what operators earn renting capacity,” Nelms wrote in response to questions for this feature. “Token prices are downstream, packaging compute consumption plus margins, product differentiation, and competitive dynamics.”
A token is the unit in which AI is sold: a fragment of a word, roughly three-quarters of one in English, generated or processed by a model. When an enterprise pays OpenAI, Anthropic or Google for API access, it pays per million tokens. When a data-center operator rents out a rack, it is paid per GPU-hour. Between those two prices, adjusted for how many tokens a GPU-hour can produce, sits an AI lab’s gross margin.
In oil, that spread has a name: the crack spread, the difference between what a refiner pays for crude and what it earns on refined products. When crude rises and gasoline falls, refiners get squeezed—unless they have found a way to get more gasoline out of each barrel. Oil markets have traded that spread for decades. AI has only had the two ends of it measurable since this year. Ornn’s Token Price Index, OTPI, which tracks realized dollars per million tokens from actual paid usage across major labs, “began settling in June 2026,” Nelms said. “We are still early.”
A surface, not a number
The first thing the data reveals is that “the price of compute” was never a single figure.
“It is a multi-dimensional surface, not a single number,” Nelms said of GPU pricing, which varies by chip, region, contract length and provider.
Ornn’s dashboard renders that surface literally. For one GPU type, a 1,024-GPU block rented for a month clears at $3.64 an hour; eight GPUs on the same terms clear at $2.85. Lock in for five years and the figures fall to $1.83 and $1.43 respectively. Two features stand out. Term discounts are steep: committing for five years cuts the hourly rate roughly in half. And, counterintuitively, big blocks pay a premium, not a discount. Contiguous capacity—a thousand chips wired together in one place—is scarcer than scattered machines, and the market prices that scarcity. (The chart does not label which chip; the figures are consistent with the H100.)
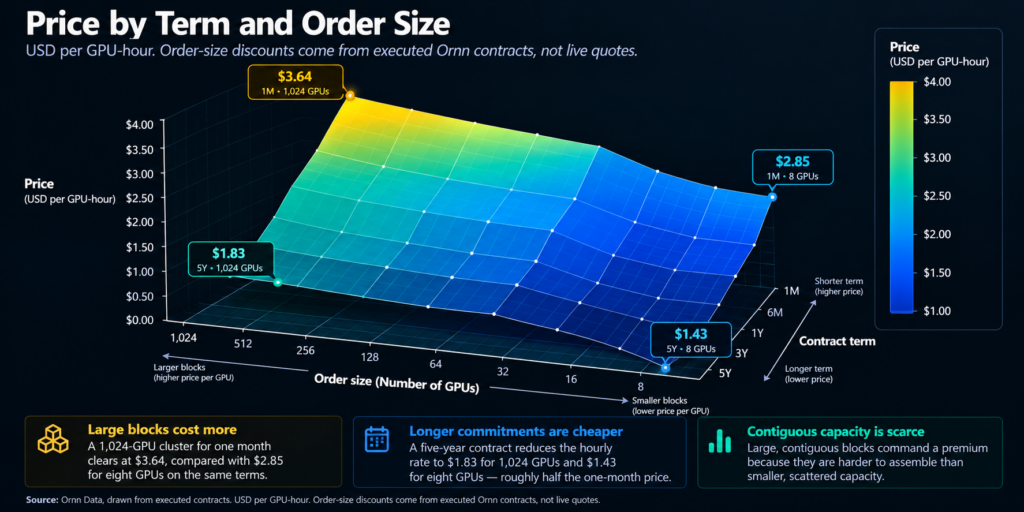
Figure 2: Price by contract term and order size, USD per GPU-hour. The surface rises toward short terms and large blocks: a 1,024-GPU cluster for one month clears at $3.64, eight GPUs at $2.85. Source: Ornn Data, drawn from executed contracts.
Term pricing shows the same pattern across every chip Ornn tracks. An H100 costs $3.14 an hour on a one-month reserved contract, $2.29 for a year, $1.79 for three years and $1.58 for five. The B200 runs $8.42, $5.67, $3.95 and $3.13 across the same commitments. Every curve slopes downward.
| GPU | 1-month term | 1-year term | 3-year term | 1-year vs 1-month |
|---|---|---|---|---|
| Nvidia B200 | $8.42 | $5.67 | $3.95 | −32.7% |
| Nvidia H200 | $5.87 | $3.70 | $2.31 | −37.0% |
| Nvidia H100 | $3.14 | $2.29 | $1.79 | −27.1% |
| Nvidia A100 | $1.06 | $0.94 | $0.85 | −11.3% |
| Nvidia RTX PRO 6000 | $1.61 | $1.10 | $1.00 | −31.7% |
Source: Ornn Data reserved-capacity term prices, USD per GPU-hour, as displayed in October 2026. The final column is calculated from the displayed one-month and one-year prices. Ornn’s dashboard also shows its own “implied 1-year depreciation” figures (−36.6% for the B200, −48.0% for the H200), which are derived on a basis Ornn does not publish and are not reproduced here.
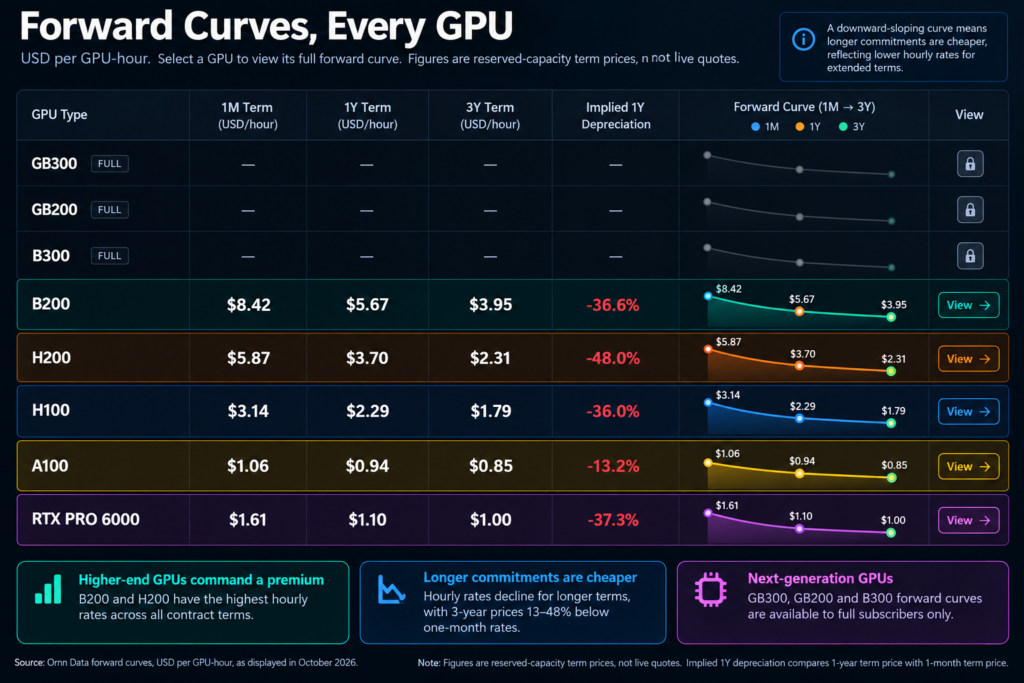
Figure 3: Reserved-capacity term prices for every GPU Ornn tracks, with Ornn’s own “implied 1-year depreciation” column. Next-generation B300, GB200 and GB300 curves are available to full subscribers only. Source: Ornn Data.
In a true futures market, a downward-sloping curve would signal that traders expect spot prices to fall. These are not futures. They are reserved-capacity contracts, and Ornn publishes them separately from its spot indices for that reason. A lower price for a five-year commitment can reflect the value of a guaranteed tenant, the risk the buyer takes on obsolescence, utilization guarantees and other terms, not only an expectation about where spot rates are heading.
Still, the gap is wide. An H200 that fetches $6.30 an hour on the spot market can be locked in for a year at $3.70. Buyers willing to commit are being paid handsomely for doing so, and sellers are offering steep discounts to convert today’s spot windfall into contracted revenue. That is a market in which operators are earning more per hour than ever and, judging by the discounts they offer, are not confident it will last.
Why tokens got cheaper while chips got dearer
How can the input double while the output halves? Three forces, each visible in the data.
The first is hardware efficiency. Nvidia claims Blackwell-generation systems cut cost per token by up to ten times versus the prior Hopper generation (Nvidia). That is a vendor figure and should be read as such, but even a fraction of it means each B200 hour yields far more sellable tokens than an H100 hour did. The price of the hour can rise while the price of what it produces falls.
The second is competition and substitution. Silicon Data’s own index distinguishes a frontier segment, reading $4.20 per million tokens in April, from an open-weight segment at $0.85 (Silicon Data). Because SDLLMTK is usage-weighted, it falls when buyers migrate toward cheaper models even if nobody cuts a price. Silicon Data has itself cautioned that a decline can reflect price cuts, a shift to cheaper open models, or both (Wall Street CN). OpenAI cut prices on its mid-tier models by as much as 80% in late July (Crypto Briefing)—a figure that traces to secondary reporting and should be checked against OpenAI’s pricing page before publication.
The third is the one that worries Wall Street. Volume is rising faster than revenue. A JPMorgan data-center note cited in the same Goldman analysis found token usage on the OpenRouter platform grew about 47% month over month in August while dollar spending rose only about 7% (Wall Street CN). The Goldman desk’s conclusion, paraphrased: more demand at lower prices is not automatically good news if prices fall faster than consumption grows. Both figures are secondhand; the underlying notes are not public.
Nelms sees the same forces from the supply side. “The market is shifting from single-supplier dominance toward a contested equilibrium,” he said, pointing to hyperscalers deploying their own chips—Amazon’s Trainium, Google’s TPUs—to regain bargaining power over Nvidia. That competition, he argues, compresses compute costs and benefits downstream users while making pricing more fragmented.
The value ladder
Lay the data along the AI value chain and a pattern emerges.
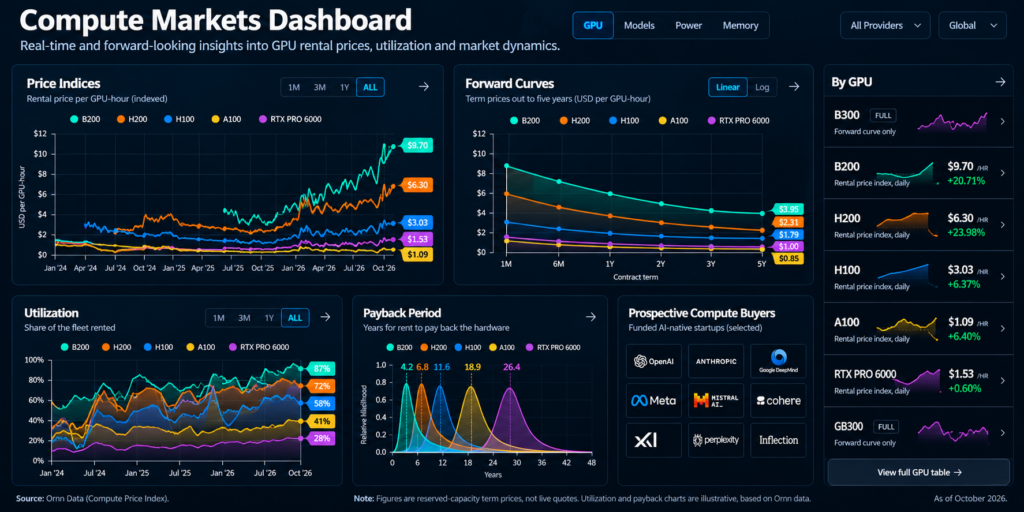
Figure 4: Ornn’s GPU analytics dashboard, October 2026: price indices, term-price curves (which Ornn labels forward curves), fleet utilization and payback period, with daily index levels for each chip at right.
Chipmakers sit at the top, and the spot market confirms their position: B200 hours at $9.70 mean the newest silicon still commands a premium nobody else in the chain can match. But the discount operators accept to lock in a year of B200 revenue—a third off the one-month rate—is also a statement about how durable they expect that premium to be.
Compute operators—the neoclouds and data-center landlords—are the paradox of the moment. Spot rates say they have never earned more per hour. The term discounts they offer say they would rather have a committed tenant than bet on spot staying high. Their economics depend on utilization and on whether they filled their racks with long-term customers or are exposed to the spot market. Ornn’s dashboard carries a “payback period” module measuring years for rent to repay hardware, which is the number every lender in this market should be watching.
Model labs are the refiners, and the arithmetic points to pressure on the spread, though not uniformly. Their input, measured in GPU-hours, has risen. Their output, measured in tokens, has halved in price. Whether a given lab’s margin is actually shrinking depends on the variable the indices cannot see: how many more tokens it now extracts from each hour. Labs that own efficiency gains—better models, better serving, cheaper routing, newer hardware—may be widening their margins even as the headline prices diverge. Labs that rent capacity on the spot market and compete on token price with older models are the ones being squeezed.
Enterprises and consumers are the unambiguous winners. Whatever a million tokens cost in May, it cost half as much by September. The surplus from a technology curve that nearly every participant upstream is fighting over flows, in the end, to the buyer of the token.
That is the pattern in most commodity transitions: value migrates downstream, then to the end user. The difference in AI is the speed. Oil took decades to build the benchmarks that made the crack spread tradable. Compute has acquired spot indices, term-price curves, token indices and exchange-listed futures in roughly eighteen months.
Benchmarks disagree, and that matters
The infrastructure for measuring all this is new enough that it does not yet agree with itself.
The Goldman note observed that H100 rental prices were falling in August. Ornn’s H100 index shows the opposite: $3.03 an hour, up 64% over the past year. The two firms sample different markets. Silicon Data publishes separate hyperscaler and neocloud series; Ornn measures on-demand transactions across a contributor network it does not name. Both can be accurate. Neither is the price any particular company pays.
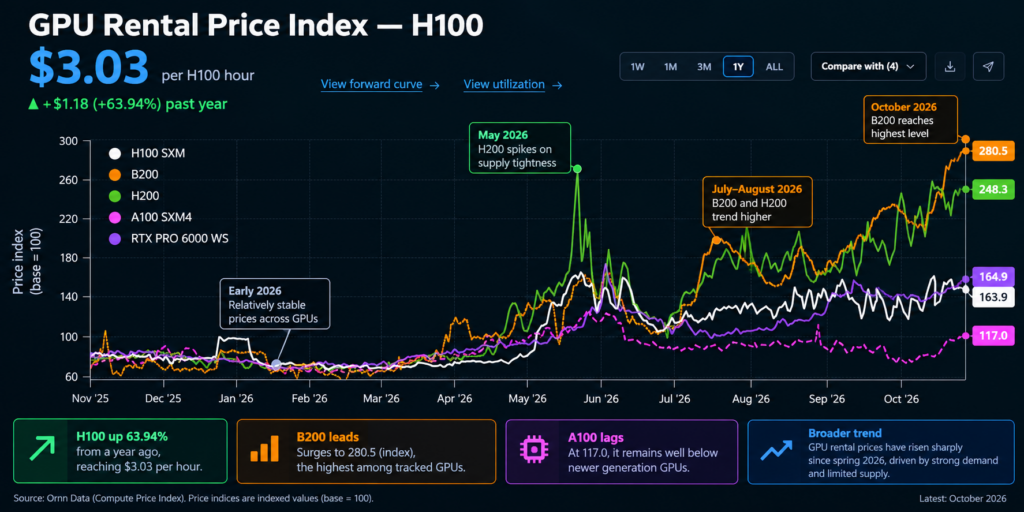
Figure 5: One-year indexed performance (November 2025 = 100). The B200 (orange) and H200 (green) have nearly tripled; the H100 (white) is up 64%; the A100 (purple) 17%. Source: Ornn Data.
Ornn’s methodology, which it supplied for this feature, is unusually candid about its limits. The index covers on-demand rentals only, excluding the reserved and long-term contracts that make up most large-buyer spending. It is calculated as a volume-weighted, winsorized mean over a rolling one-hour window, with counterparty verification and anti-wash-trade controls. The winsorization percentile that trims outliers is not published. An independent Oversight Committee with a majority of outside members is described as being established, not yet constituted. And the document discloses a structural conflict: Ornn affiliates transact in physical GPU capacity, the very market the index measures, though it states that neither Ornn nor any affiliate trades products indexed to OCPI and that affiliate transactions receive no preferential treatment.
Nelms says Ornn aligns its governance with the IOSCO Principles for Financial Benchmarks, the standard behind most commodity benchmarks. “Standardized pricing is a financial primitive,” he said. “It enables futures, residual value products, and better underwriting.”
That is true, and it cuts both ways. A primitive that lenders use to underwrite billions in data-center debt needs the oversight committee seated, the conflicts register published and the methodology stress-tested by people who do not work for the index provider. Those are the conditions on which the oil benchmarks Nelms invokes were built—often after scandal, not before.

What the spread is saying
Strip away the novelty and the data makes a simple argument.
Compute is behaving like a commodity in a supply squeeze: spot prices high, steep discounts for commitment, big blocks at a premium. Tokens are behaving like a product in a price war: effective prices halving in a quarter, volume exploding, revenue flat. The spread between them is the margin on which AI application businesses are built, and the headline indices say it is under pressure from both ends—unless efficiency gains per GPU-hour are closing the gap faster than the prices are opening it.
The investors funding a trillion dollars of 2027 capital expenditure are, in effect, long the spread. They are betting that the output price stabilizes before the input price normalizes, or that volume growth outruns both. The term discounts suggest sellers do not expect input prices to hold. The token index says output prices have already fallen. What neither index can tell us is whether demand grows fast enough, or efficiency improves fast enough, to fill the gap.
“Oil did not become a mature financial market until it had a trusted benchmark,” Nelms said. “Compute is on a similar path.”
He is right about the path. But oil’s lesson was never only about benchmarks. It was about who sat between the wellhead and the pump. In oil, the money was never in the barrel. It was in the refinery. In AI, the open question of 2026 is whether anyone owns the refinery at all—or whether the value is passing straight through to the people buying the tokens. editor@ictpost.com
Wayne Nelms, chief technology officer of Ornn, interviewed for this feature. Ornn supplied its index methodology, term-price data and dashboard figures.